- Blog
- Solar Power
- Solar energy facts and statistics
Australian solar energy facts and statistics
- Solar Power
- 3 min read
Solar panels continue to be installed on household rooftops in Australia at an increasing rate generating clean, renewable energy from the sun.
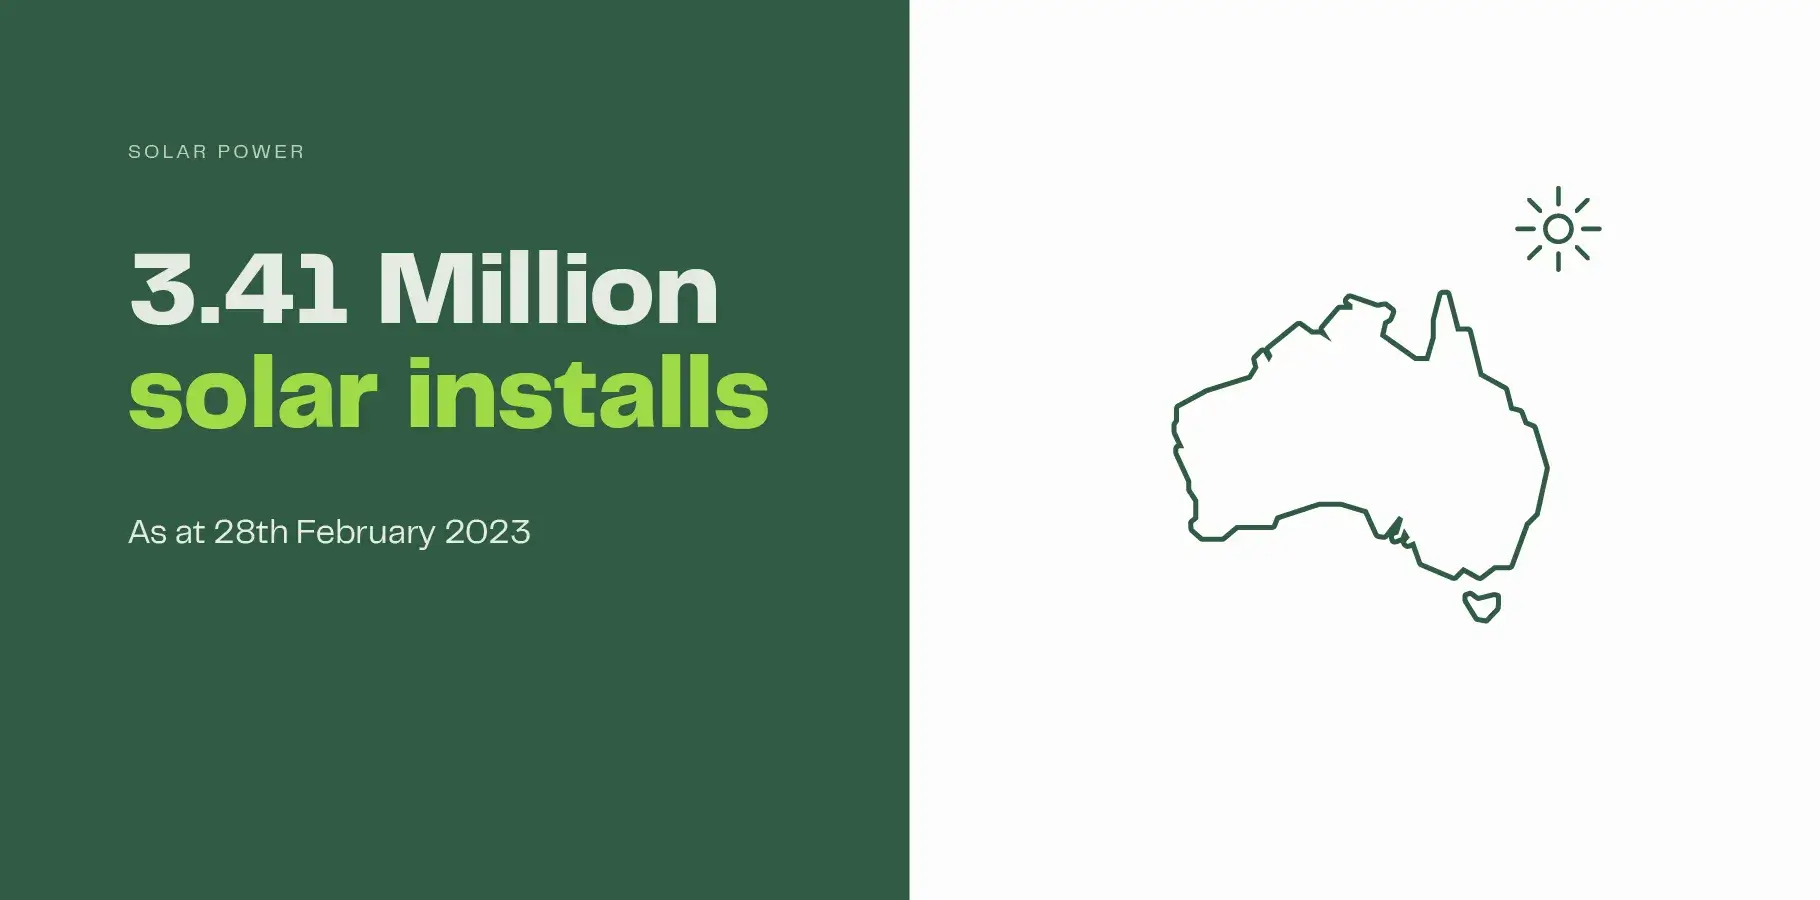
Australia’s Clean Energy Regulator reports that as at the end of February 2023, a total of 3.414 million solar power systems have been installed on Australian homes and small businesses. With an estimated number of 10.8 Million homes in Australia, this brings the total of all households in Australia that have solar panels to 31.46%.
Australian solar install statistics
The total number of small-scale solar installations in Australia as 28th February 2023:
- 3.414 Million installations
- 31.46% of all Australian homes have solar
2022 Installation figures
In 2022, there were 307,512 small-scale system installed in Australia. New South Wales again led the way with 90,910 installations.
| State | 2022 Installs |
|---|---|
| New South Wales | 90,910 |
| Victoria | 59,913 |
| Queensland | 75,508 |
| Western Australia | 38,363 |
| South Australia | 28,175 |
| Australian Capital Territory | 8,910 |
| Tasmania | 4,008 |
| Northern Territory | 1,725 |
Source: Clean Energy Regulator
Installation figures are generally trending up
Installation figures are on the rise in Australia, back in 2016, there were only 132,696 systems installed. The graph below shows the rise in installs every year from 2016 through to 2022:
Australian total solar install statistics
| Year | Installs |
|---|---|
| Pre 2016 | 1,509,422 |
| 2016 | 132,697 |
| 2017 | 174,942 |
| 2018 | 224,852 |
| 2019 | 284,031 |
| 2020 | 370,320 |
| 2021 | 377,458 |
| 2022 | 315,709 |
| 2023 | 329,729 |
| 2024 | 110,823 |
| Total | 3,829,983 |
Drop recorded in 2022 installs
The number of small-scale solar installs in 2022 was 307,512, a significant drop from 2021. It’s worth noting that the install figures are recorded when STCs are submitted to the Regulator, so there is typically a time lag between the actual install and the recorded install. The drop in installs in 2022 may be attributed to the impact lockdowns had on the solar market in 2021 and 2022.
*Small-scale installs include any system under 100kW in size. Predominantly, these are solar panels installed on household rooftops.
The Clean Energy Regulator forecasts solar activity to remain strong, a little below levels experienced at the height of 2021.
Battery installs increase 58.7%
While the number of solar units installed in 2022 dropped, it was a different story for battery storage which saw a whopping 58.7% rise in installs. A total of 20,946, solar panel and battery units (hybrid systems) were installed in 2022, up from 13,167 in 2021.
Batteries are slowly improving their financial worth with lower feed-in tariffs. However, functionality like backup power, the want to charge electric vehicles and, an increasing desire for energy independence that is driving demand for solar batteries.
Electrical vehicle uptake is increasing
Australia’s appetite for electric vehicles is one the rise. Data prepared by the Federal Chamber of Automotive Industries shows that electric vehicles represented 6.8% of all new car sales in February 2023. Just 6 months earlier in August 2022, EVs represented just 4.4% of all new car sales.
Australians are installing larger systems
The average system size installed in Australian homes and small businesses in 2022 was 8.74 kW. Compare this to 2020 when the average system size installed was 7.92 kW. While the figures are skewed slightly higher to account for systems installed on small businesses, the upshot is that homeowners are choosing to put more panels on their roof and opt for a larger solar system.
Electricity production in Australia
Renewable energy continues to contribute an increasing supply of Australia’s electricity needs. In 2021, 29% of Australia’s electricity came from renewable sources, up from 22.5% in 2020. Solar energy is now the largest source of renewable generation in Australia, in 2021, solar contributed 37% (up from 35% in 2020) of all renewable generation and 10% (up from 8%) of total electricity generation.